 学习讨论
下载与应用实例
资料服务
首页
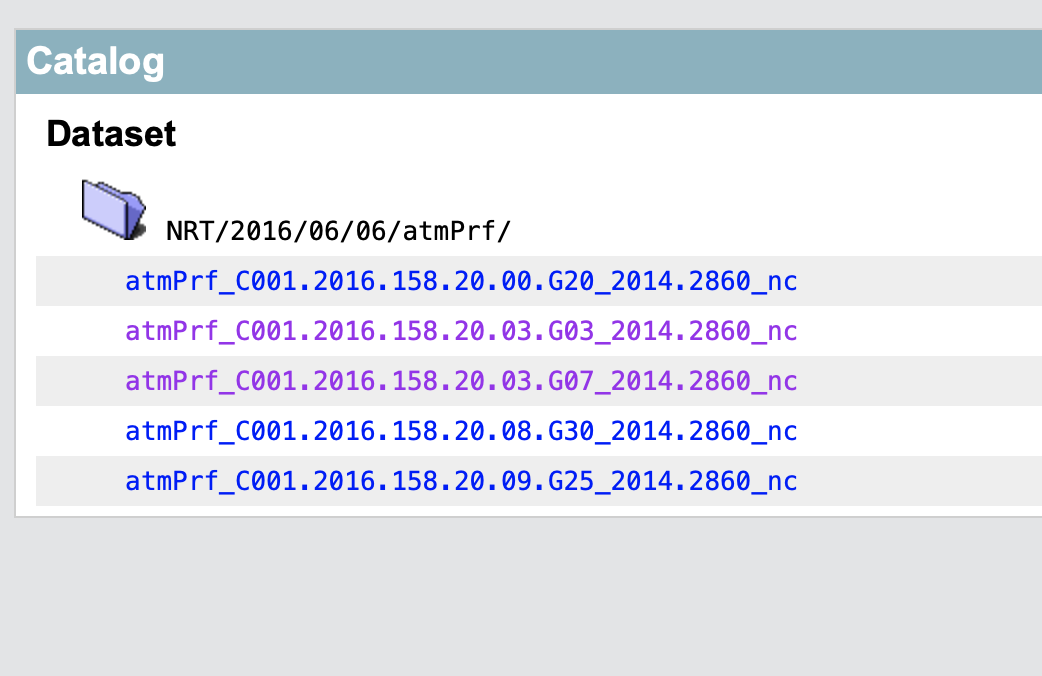
THREDDS资料服务平台可以使用户远程浏览及下载资料。 浏览包括直接阅读资料的自说明(MetaData/Attributions)而无需下载。 这是由于服务平台使用了网络协议OPeNDAP, 可以通过网络远程解读NetCDF, HDF等常用格式的资料 以下以浏览2016年6月6日COSMIC的NRT干空气反演资料为例, 在点击浏览到资料2016年6月6日页面时:

点击文件atmPrf_C001.2016.158.20.03.G03_2014.2860_nc, 你会得到该文件的在服务平台的一些信息。

点击OPeNDAP, 你会得到该文件的详细说明, 点击HPPTServer则将下载该资料:

以2016年6月6日COSMIC的NRT干空气反演资料为例, 点击URL地址窗口得到资料集的路径:http://120.48.72.103:8080/thredds/catalog/allCosmic/NRT/2016/06/06/atmPrf/catalog.html

用wget即可下载2016/06/06/全天的资料:
wget -e robots=off -nH --cut-dirs 6 -nc -r -l2 -A '*_nc' -R 'catalog*' -I /thredds/fileServer/,/thredds/catalog/ 'http://120.48.72.103:8080/thredds/catalog/allCosmic/NRT/2016/06/06/atmPrf/catalog.html'
注意命令中的选项, "-l2"很关键! 它让wget寻找当前目录及子目录(共2层)中的资料; :”--cut-dirs 6“则是移除前6个目录名(/thredds/catalog/allCosmic/NRT/2016/06/)。你下载的资料将放在目录“06“下。详细解释请阅读”wget“命令说明。由此可见, 如果将地址换成2016年6月的资料集的路径, 将“--cut-dirs”设置为4, 将“l”设置为4,则将下载6月全月的资料:
wget -e robots=off -nH --cut-dirs 5 -nc -r -l4 -A '*_nc' -R 'catalog*' -I /thredds/fileServer/,/thredds/catalog/ 'http://120.48.72.103:8080/thredds/catalog/allCosmic/NRT/2016/06/catalog.html'
THREDDS资料服务平台可以使用户远程直接调用资料而无需下载。 以下例子给出在本地计算机上用python程序绘制的探空曲线。 资料选用2021年4月30日江苏境内的COSMIC2探测资料(wetPf2_C2E2.2021.120.09.14.G01_0001.0001_nc):
         import matplotlib.pyplot as plt
         import netCDF4 as nc
         import numpy as np
         from metpy.plots import  SkewT #画埃玛图
         from matplotlib.ticker import  MultipleLocator
         from matplotlib.ticker import  FormatStrFormatter
         from cartopy.mpl.ticker import LongitudeFormatter, LatitudeFormatter
         from metpy.units import units #单位
         import metpy.calc as mpcalc #计算一些参数用,比如 抬升凝结高度

         url = "http://120.48.72.103:8080/thredds/dodsC/\
         COSMIC2-nrt_wetPf2/20210430/wetPf2_C2E2.2021.120.09.14.G01_0001.0001_nc"
         file = nc.Dataset(url)

         def cal_dew_point_temp(e):
             a = 17.62; b = 243.12;
             td = (b*np.log(e/6.112))/(a-np.log(e/6.112))
             return(td)

         def main():

             vp = np.array(file.variables['Vp'][:])
             ps = np.array(file.variables['Pres'][:])
             alt = np.array(file.variables['MSL_alt'][:])
             tempp = file.variables['Temp'][:]
             temp = np.array(file.variables['Temp'][:])

             Td = cal_dew_point_temp(vp)

             # plot
             fig = plt.figure()
             #以下画图! 略 ....

        import matplotlib.pyplot as plt
        import cartopy.crs as ccrs
        import cartopy.io.shapereader as shpreader
        import pickle
        from xml.dom import minidom
        from urllib.request import urlopen
        from urllib.request import urlretrieve
        import netCDF4
        extent = [112.-1E-2, 124, 28, 36]   #定义区域
        # 定义服务器地址及资料的路径
        server_url = 'http://120.48.72.103:8080/thredds/'
        request_url = 'catalog/COSMIC2-nrt_atmPrf/20210430/'

        def inArea(Lat, Lon):               #布林函数,经纬度在定义区域内为True
            lonW = extent[0]
            lonE = extent[1]
            latS = extent[2]
            latN = extent[3]
            if lonW < Lon < lonE and latS < Lat < latN:
                return True
            else:
                return False

        #服务器提供的路径实际指向一个xml文件, 下面的程序从xml文件中提取所需的信息
        #在以下的例子里则是数据集(dataset)以及数据集中各文件的路径(attribute_name)
        def get_elements(url, tag_name, attribute_name):
          usock = urlopen(url)
          xmldoc = minidom.parse(usock)
          usock.close()
          tags = xmldoc.getElementsByTagName(tag_name)
          attributes=[]
          for tag in tags:
            attribute = tag.getAttribute(attribute_name)
            attributes.append(attribute)
          return attributes

        #将区域内的观测资料挑选出来
        def pickNeeded():
          url = server_url + request_url + 'catalog.xml'
          catalog = get_elements(url,'dataset','urlPath')
          files=[]
          pickedFile=[]
          for citem in catalog:
            if (citem[-3:]=='_nc'):       #只需要netCDF文件
              files.append(citem)
          count = 0
          for f in files:
            file_url = server_url + 'dodsC/' + f
            ncfile = netCDF4.Dataset(file_url)
            lon = ncfile.getncattr('lon')
            lat = ncfile.getncattr('lat')
            if inArea(lat, lon):
                hour = ncfile.getncattr('hour')
                minute = ncfile.getcattr('minute')
                onepoint = [lat, lon, hour, minute]
                pickedFile.append(onepoint)
                count +=1
          return pickedFile

        def main():
            fig = plt.figure(figsize=(12, 9))
            mapcrs = ccrs.PlateCarree()
            ax = fig.add_subplot(111, projection = mapcrs)
            extent = [112.-1E-2, 124, 28, 36]
            gl = ax.gridlines(crs=ccrs.PlateCarree(), draw_labels=True, color='black', linestyle='--', alpha=0.5, linewidth=0.5)
            gl.top_labels = False
            gl.bottom_labels = True
            gl.left_labels = True
            gl.right_labels = False
            gl.xlines = True
            gl.ylines = True

            ax.set_extent(extent, crs=ccrs.PlateCarree())
            ax.coastlines(resolution='50m', color='grey')
            ax.add_feature(cfeature.LAND)
            ax.add_feature(cfeature.LAKES)
            ax.add_feature(cfeature.RIVERS)

            pickerFiles = pickNeeded()
            pickedFiles = pickle.load(file)
            pointNum = len(pickedFiles)
            for i in range(pointNum):
                timeStr = str(pickedFiles[i][2])+':'+str(pickedFiles[i][3])
                ax.plot(pickedFiles[i][0],pickedFiles[i][1], marker='.', markersize=15, color='b', alpha=1)
                ax.text(pickedFiles[i][0],pickedFiles[i][1],timeStr,fontsize=15, color='r')

            plt.savefig('JSarea.png', dpi=300)
            plt.show()

        # Run main function when in comand line mode
        if __name__ == '__main__':
          main()
